I just answered a beginner question on how to do standard error and standard out to logs on Bluemix. Here are the basic steps. You need to utilize the Monitoring and Analytics Service with the Java Liberty Runtime. Similar logging is possible with the other runtimes and languages too. This also demonstrates how to use DevOps Services.
If you have created a Java app using the Liberty Runtime from the IBM BLuemix Dashboard do the following:
1 Add the project to DevOps Services by pushing the “ADD GIT” Link on your App Dashboard. Accept defaults
2 Click on Edit code link that then appears
3 Click edit code button, using DevOps Services Web IDE Edit the src/com/ibm/cloudoe/samples/HelloResource.java Add the 2 lines below to sending messages to standard out. import static java.lang.System.out; and System.out.println(“This is test “);
package com.ibm.cloudoe.samples;
import javax.ws.rs.GET;
import javax.ws.rs.Path;
import static java.lang.System.out;
@Path(“/hello”)
public class HelloResource {
@GET
public String getInformation() {
// ‘VCAP_APPLICATION’ is in JSON format, it contains useful information about a deployed application
// String envApp = System.getenv(“VCAP_APPLICATION”);
// ‘VCAP_SERVICES’ contains all the credentials of services bound to this application.
// String envServices = System.getenv(“VCAP_SERVICES”);
// JSONObject sysEnv = new JSONObject(System.getenv());
System.out.println(“This is test “);
return “Hi World!”;
}
}
4 In DevOps Services. Click on Pipeline, You must commit your code change click message that pops up at the top to go to Git.
5 In DevOps Services. You must then select “push” from left menu to push out changes to be build and deployed.
6 Add the Monitoring and Analytics Service to your Space. + Add Service
7 Bind the Monitoring and Analytics to your App. In your JavaStandardOut App + Bind a Service or API choose your Monitoring and Analytics.
8 Accept it to restage
9 Click on link to see your app in browser and call your standard out code. Go to route/link for your app at the top of your page.
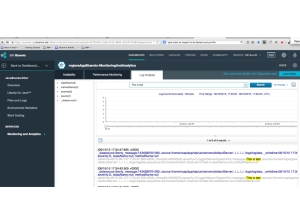
10 Go back to your App Dashboard Choose Monitoring and Analytics from the menu.
11 In Monitoring and Analytics, Search on This is a Test message See log and your message. See image below.
Get the code:
https://hub.jazz.net/project/carlosf/JavaStandardOut/overview
For CloudFoundry Applications Logging happens at multiple levels
Log Types – Their Messages
API
STG
DEA – Droplet Execution Agent emits DEA logs beginning when it starts or stops the app. Important for troubleshooting deployment failures
RTR
LGR
APP – Application level – using stderr and stdout
Read the docs: http://docs.cloudfoundry.org/devguide/deploy-apps/streaming-logs.html
You don’t have to use IBM Monitoring and Analytics to see the logs. You can also use the CloudFoundry CLI and invoke the command $cf logs <> — recent
Another option is to use a Third Party Service like PaperTrail You have to create a separate account with PaperTrail(https://papertrailapp.com/) and then add the services using this approach: http://docs.cloudfoundry.org/devguide/services/log-management.html


